Debugging YaST
YaST is written in many programming languages. That means you will need a
specific debugger for each language. In theory you could use gdb for
debugging any language but for interpreted ones it would be really
difficult.
Debugging Ruby Code
For debugging Ruby code you need to install the Ruby debugger - byebug Ruby gem.
The package is not installed by default, you can install it by this command:
sudo zypper in 'rubygem(byebug)'
If the package is not available in your repositories you can install it from YaST:Head or devel:languages:ruby:extensions repositories.
Starting the Debugger in Installed System
Make sure the Ruby debugger is installed in the system, see the installation instructions above.
Using a Keyboard Shortcut
Package yast2-ruby-bindings-3.2.2 (and newer) include a keyboard shortcut
for starting the debugger directly from running YaST. Simply press the
Shift+Ctrl+Alt+D keyboard combination in the Qt UI and the Ruby debugger
will be started automatically. The text mode (Ncurses UI) is currently not
supported, use the other solution below.
Starting the Debugger Automatically
Recent YaST versions (see the supported systems below) have built in support for starting the debugger automatically. Simply run
Y2DEBUGGER=1 yast2 <client>
and the debugger will be started automatically.
 Warning: The debugger port (3344) is accessible to anyone on the
local machine and byebug does not use any sort of authentication. That means it
is a potential security issue, enable the debugger only if you really need it!
Warning: The debugger port (3344) is accessible to anyone on the
local machine and byebug does not use any sort of authentication. That means it
is a potential security issue, enable the debugger only if you really need it!
Starting the Debugger Manually from YaST
You can start the debugger manually in any Ruby code. Just require the Ruby
debugger and start it.
The disadvantage is that you need to touch the code and modify the YaST files. The advantage is that you can start the debugger at the specific place where you need to debug the code.
Graphical Mode
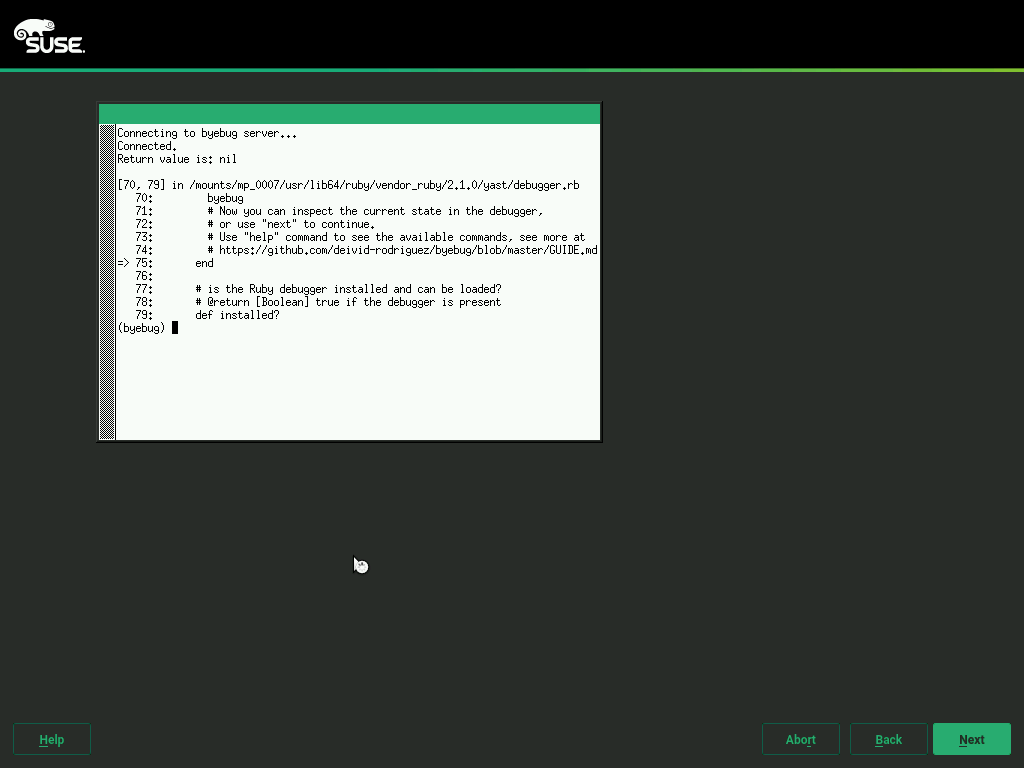
If you run YaST in graphical mode then just add this code snippet at the place where you want to start the debugger:
require "byebug"
byebug
The debugger session will be started at the console from which the YaST module has been started (therefore do not run it from the YaST control center but manually from a terminal window).
Text Mode
Starting the debugger in YaST running in text mode is more complicated because the debugger front-end cannot be displayed at the same console where the ncurses UI is running.
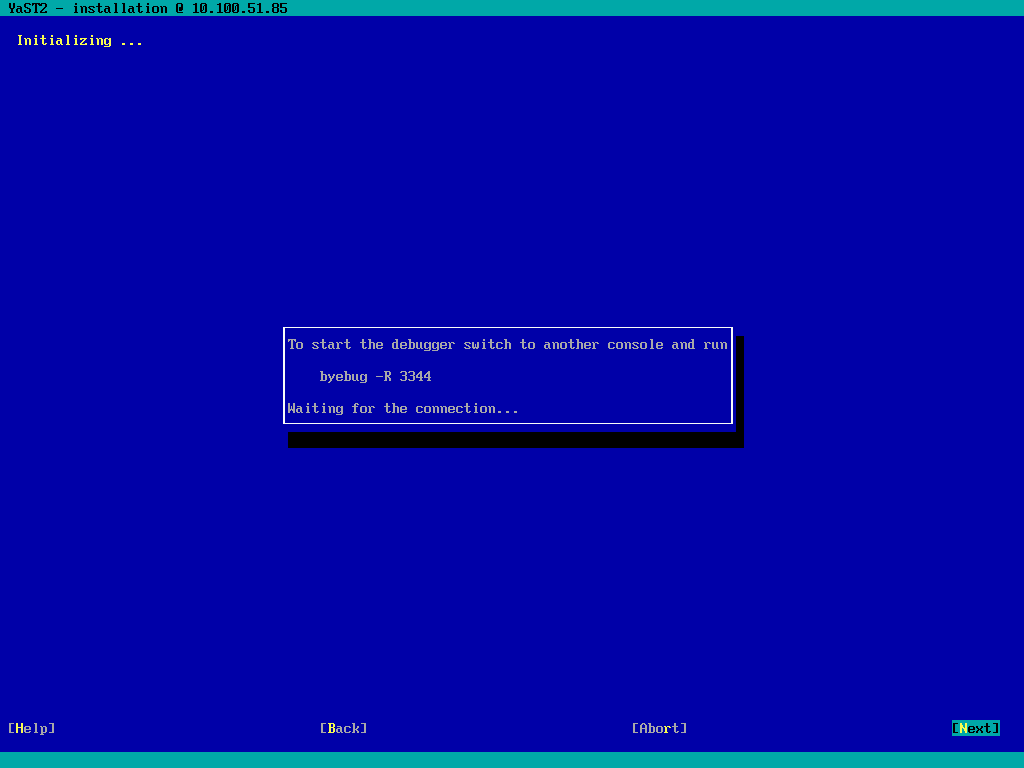
The workaround is to use "remote" debugging and run the debugger front-end at a different console. Add this snippet at the place where you want to start the debugger.
require "byebug"
require "byebug/core"
Byebug.wait_connection = true
# change the port if 3344 is already used
Byebug.start_server("localhost", 3344)
byebug
Then start the YaST module and connect to the debugger from a different console
using the byebug -R 3344 command.
Warning: The debugger port (3344) is accessible to anyone on the
local machine and byebug does not use any sort of authentication. That means it
is a potential security issue, use this feature with caution!
 Note: For a real remote debugging replace
 localhost by
0.0.0.0, the debugger will be accessible from the network (if not blocked
by the firewall). Then run byebug -R <host>:3344 from another machine to
connect to the debugger.
Warning: In this case anyone from the network who connects to the
debugger port effectively becomes the root user!
Starting the Debugger in Installation
Starting the debugger during installation is more difficult than in installed system. You cannot easily install packages or edit the source files as the root file system is located in a read only RAM disk image.
Fortunately YaST has integrated support for running the debugger in the installer.
Using a Keyboard Shortcut
The latest systems include support for starting the debugger directly
after pressing the Shift+Ctrl+Alt+D keyboard combination.
See more details in the section above.
Supported Systems
- openSUSE Tumbleweed 20161117 or newer
Using the Integrated Debugger
Supported Systems
- openSUSE Tumbleweed 20160602 or newer
- openSUSE Leap 42.2 or newer
- SUSE Linux Enterprise Server/Desktop 12 SP2 or newer
Enabling the Debugger
To enable the integrated debugger boot the installation with Y2DEBUGGER=1 boot
option.
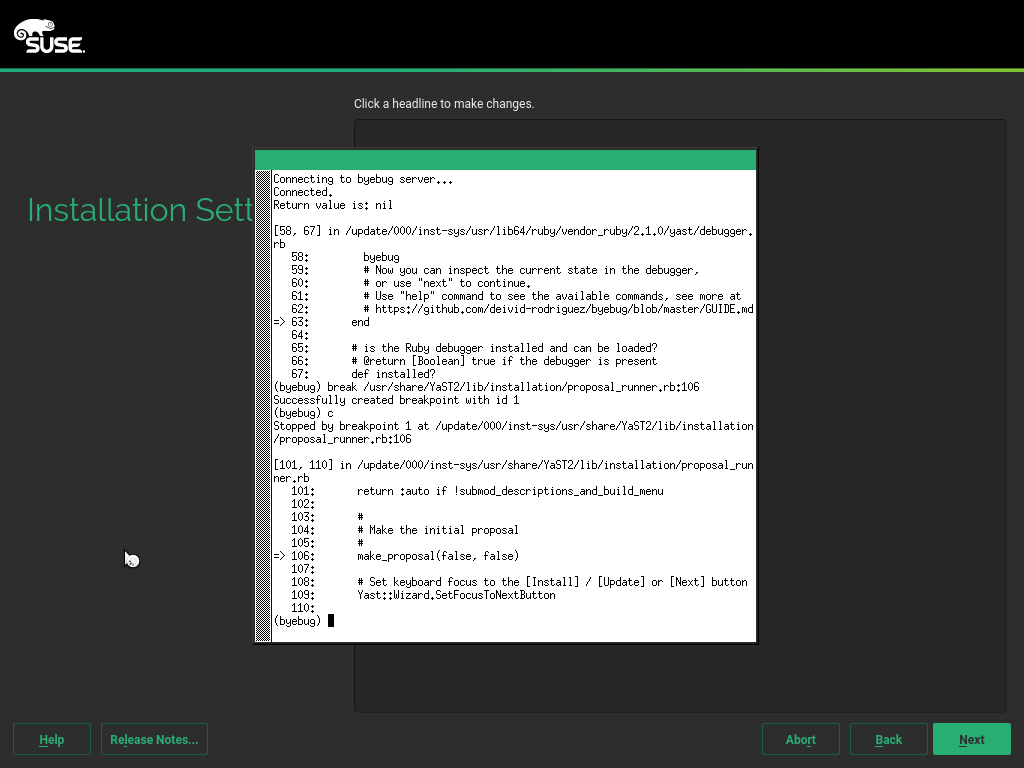
In graphical mode the debugger console is automatically opened and you can trace the installation there.
In text mode you need to manually switch to another virtual console and run the debugger manually.
If you cannot switch to another console (e.g. you are installing over a serial line) then you can use remote debugging, see below.
Remote debugging
There are two possibilities how to run a remote debugging:
- SSH installation:
- Boot the installation with
Y2DEBUGGER=1 SSH=1 - Connect from a remote machine, if you use a graphical installation then the debugger should appear in a separate window just like in a standard installation.
-
In text mode you need to start additional SSH connection to the installation system and run the debugger session manually, follow the instructions displayed by the installer.
-
Run the debugger front-end on a different machine. Use this option if for whatever reason you cannot run a SSH installation.
Warning: In this case anyone from the network who connects to the
debugger port first can watch or modify the installation. This is a security
risk, use this option only in a trusted network!
- Boot the installation with Y2DEBUGGER=remote, the debugger will be
accessible from the network.
- You need the byebug Ruby gem installed on the machine where you connect
from, see the installation instructions at the beginning.
- The installer will print the command (in format byebug -R <ip>:<port>)
which you need to run.
Generic Crash Handler
When YaST crashes in Ruby code and the Ruby debugger is installed in the system then the error pop up additionally asks for starting the debugger:
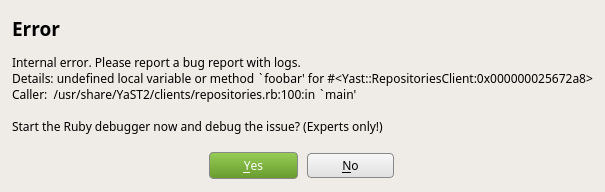
After confirming the debugger a debugging session is started.
This crash handler is available also in the installer.
Using byebug
Here is just a basic description of byebug, you should read the full byebug documentation to get more details.
Basic Usage
Byebug provides a REPL (Read-Eval-Print Loop), here is just an overview of the basic commands:
| Command | Shortcut | Description |
|---|---|---|
| next | n | execute the next line |
| step | s | step into a block or a method |
| break | set a breakpoint | |
| finish | start execution until end of the current frame | |
| continue | c | continue executing the code until a break point or the optional line number argument is reached |
| backtrace | bt | print the backtrace |
Use the help command to list all available commands.
If you enter any input which is not recognized as a byebug command it will be evaluated as a Ruby code. This way you can easily inspect the current state or execute any Ruby code interactively.
If your Ruby code conflicts with a byebug command use eval command to
run the code evaluation explicitly. For more complex input use the irb
command which starts an
IRB session.
Debugging Hints
Debugging Workflow
Unlike GDB which can be attached to any running process the Ruby debugger cannot stop the running Ruby code and inspect it. Then means you have to start the debugger in advance, you cannot start it later from outside.
Therefore you need to trace the code step by step or add enough breakpoints to be sure that the execution stops when you need.
Breakpoints
Breakpoints cannot be added at any source code line, only to the stopping points.
Use info file command to list the stopping points. See more details in the documentation.